
Dear Fellow Investors and Friends,
Welcome to my newsletter, where I share my efforts to understand markets and the world around me.
I do appreciate you taking the time to read this. I love getting feedback; feel free to drop me a line. It’s great to start conversations.
Today is Thursday, 1 October, the 274th day of the year. There are 91 days left in the year. Yesterday Amanda and I celebrated our 5th wedding anniversary – yes, I know, I’m a late bloomer. Today also happens to be Lincolnshire Day – Lincolnshire being where Amanda’s parents live. Both celebrations have absolutely nothing to do with the rest of this letter.
Sometimes it’s just fun to celebrate, whatever the occasion.
I remember a time when the speed limit on South African highways was 80 km/h, later reduced to 70 km/h. Petrol stations also closed at 6 pm and didn’t reopen until 6 am the next morning. They were closed at weekends, too! My friends and I once drove to Durban overnight, and we had to “freewheel” down the hills to make sure we could get there on one tank of petrol, as there was no chance of refilling en route.
Queues at petrol stations were common. Fuel use was restricted for activities such as boating and recreational flying.
All this happened because of the Arab oil embargo of 1974/5 and, later, the Iranian revolution in 1979, which reduced oil supplies. It was a classic supply-driven crisis. Despite its abundance in the Earth’s crust, oil became scarce for a few years. One way to dampen demand to match the temporarily reduced supply was to limit usage via draconian restrictions. These restrictions proved successful, but nowhere near as effective at reducing demand as a massive price increase.
The price of petrol increased fivefold from 1972 to 1980, rising from 10c to 55c per litre. Inflation in South Africa was 6.7% in 1972, a year before the oil crisis, and by 1978 it had reached 13.7%. Globally, interest rates were hiked, peaking in the USA in the early 80s and in South Africa a decade later.
As a result, South Africa – and the world – entered a recession. A world of elevated inflation and the resulting high interest rates hurt growth.
Many fear we are facing a similar scenario today.
But the 70s are not the historical period we should look to when thinking about what’s happening today. More on that to follow.
There’s one similarity that remains, though: carbon-based energy sources are still abundant. Any inflationary impact from a supply shock will be short-lived, as higher oil prices will incentivise an infrastructure build-out, which will eventually reduce prices again. This process has already begun.
The key point is that this infrastructure build-out comes on top of a massive AI infrastructure build-out and a general re-engineering of global supply chains. The push towards greater electrification adds further momentum to this capex boom.
The net result is that, despite higher energy prices, global growth remains strong. The IMF projects global growth at 3.0% in 2026 and 3.4% in 2027. PMIs have been surprisingly strong, and CEO confidence continues to climb. This is very different from the 70s/early 80s (tell me how old you are without telling me how old you are!).
No, I think this is more like the post-WWII 1940s period. It might surprise some readers, but I was not around at that time! I have done some reading about events at that time though.
The key feature was a post-war rebuild in Europe, requiring significant infrastructure spending, coming at a time when government finances were in a mess after a spending spree on the war effort.
Infrastructure buildouts are expensive and create long-lived assets, so they are typically financed with debt. The ramp-up in spending on AI-related data centres is a case in point. But as in the post-WWII period, today’s infrastructure-related debt sits on top of the debt Western governments have already accumulated; debt levels which continue to rise due to sticky spending programmes.
When private debt competes for allocation alongside a steady supply of government debt, interest rates are the casualty. Higher bond yields are needed to attract investors. But governments can’t afford these higher interest rates, as budgets are already stretched. So governments end up doing what they always do – jamming market signals and nudging Adam Smith’s invisible hand in the desired direction: affordably lower interest rates.
This jamming mechanism, used post-WWII and most likely to be implemented in the current period, is called financial repression, in which a cap is placed on bond yields, making debt more affordable. Interest rates that are not high enough to dampen inflation effectively allow governments to inflate away their debt.
The capping of long-term rates, the capping of the US dollar, the Fed’s inclination to sit on its hands, the continued outperformance of bank shares in most Western markets, and the rebound in North Asian currencies… are all markers of a reflationary world.
A world of high growth and high inflation might turn into a boom town. Gavekal’s four-quadrant approach helps us determine what will do well in such a world:
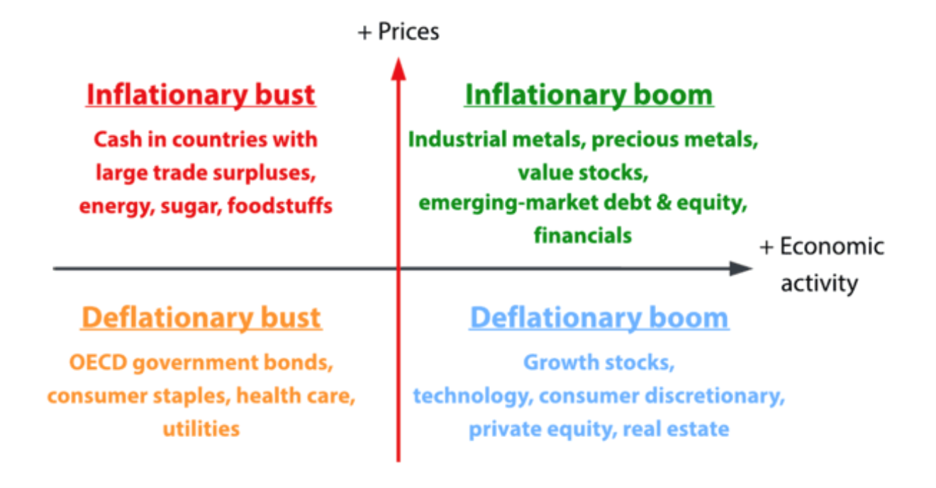
The key point is not to take this as a forecast of what might happen, but to point out that if this future unfolds, most portfolios are woefully unprepared.
In The Markets
1. Where’s Wally?
There’s an old visual game called “Where’s Wally?”, the point of which is to identify a single human figure – called Wally – amongst a sea of other figures. Even though Wally is a striking figure, it’s hard to find him, as there are so many others around that all the figures end up looking similar.
A few weeks ago, I described my “Inverse bright shiny thing theory”. It holds that when the whole market is fixated on one thing, the best investment opportunities lie elsewhere. Today, everyone is an AI specialist – they know a lot about LLMs, inference and training, chips and gigawatts. Everything looks like a figure out of “Where’s Wally”.
But what about the places no one is looking at or thinking about? Where’s Wally?
Here are a few ideas:
(a) Energy
Global fund managers have never been as underweight in the energy sector as they are now:
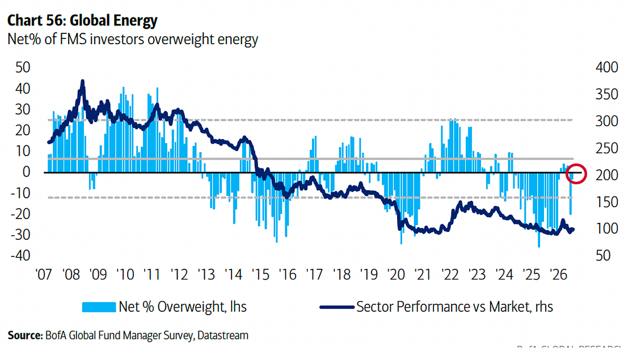
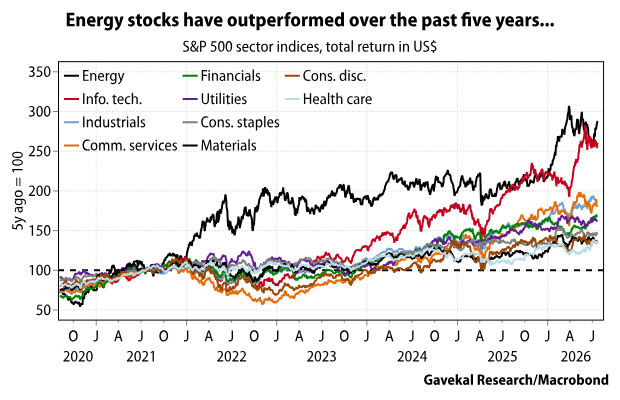
This is despite it being the best-performing sector over the past 5 years.
What happens if there is a real energy crisis? Or, if the data centre roll-out actually happens?
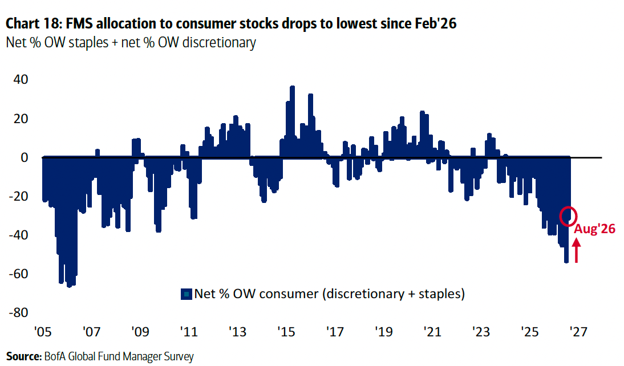
(b) Fashion
Fashion (a subset of consumer discretionary stocks) has never been more out of fashion.
Maybe people will start dressing up to chat with their favourite LLM?
Who knows, but it won’t take much to get this sector going again!
(c) China
Investors are systematically underweight Emerging Markets:
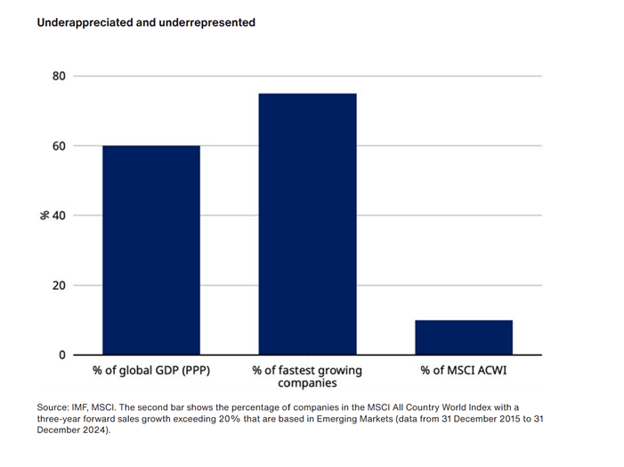
Within EM, their biggest underweight is China. So, it’s a double whammy for the so-called “uninvestable” Middle Kingdom.
(d) Japan
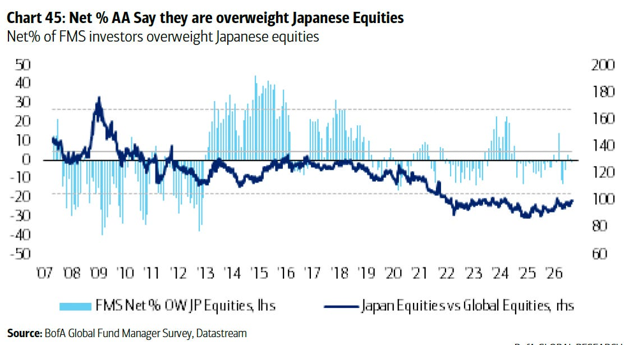
Japan is a big, liquid market which is benefiting from all the big trends (AI, defence, shipbuilding, industrialisation, electrification). And very few own it. What’s not to like?
My take: If I were an active manager, these are the areas where I’d look for good investments.
2. Oil – is it too cheap?
According to the historical chart of the gold-to-oil ratio, oil is currently far too cheap when priced in gold terms:
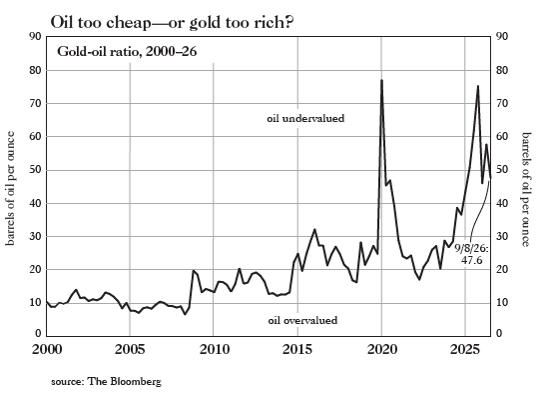
Of course, it could also mean gold is too expensive. Be that as it may, amid the largest supply disruption in a generation, the oil price has not risen as much as expected. It’s high – but shouldn’t it have been higher?
There are a few explanations for the lower-than-anticipated oil price:
- In the past, disruption was met with strategic reserves; reserves that are possibly half-exhausted by now.
- A one-off contribution from oil at sea that will eventually have to be refilled.
- China is importing a lot less than usual.
- Existing refineries are running at full or near-full capacity, and maintenance shutdowns are being delayed.
Analysts Goehring and Rozencwajg say that what appears to be resilience is simply the depletion occurring out of sight. The calm in the petroleum markets today is not evidence that the system weathered the shock. It is the temporary silence of a draw taking place where almost nobody is looking.
Despite this muted reaction in oil prices to the easing of supply bottlenecks, the energy sector has been the best-performing equity sector in the USA over the past few years, as I showed earlier.
This performance has unfortunately not benefited many portfolios, as energy is almost a negligible percentage of the index, especially as compared to technology. This was not always the case historically.
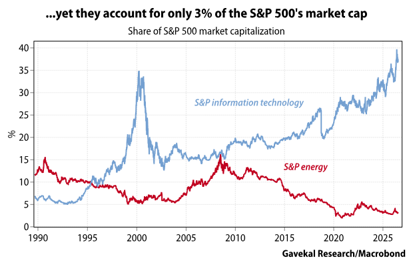
Recently, we have seen even more scary news with respect to the energy market:
- Bombs, drones and missiles hitting Saudi Arabia, including the Riyadh airport;
- News that Iran was starting the mobilisation of hundreds of thousands of men;
- More refineries have been blown up in Russia, including one on the outskirts of Moscow;
- A reported 14% of French petrol stations running dry;
- President Donald Trump signing the “Lindsey Graham Act”, which will impose, starting on September 30, tariffs of 100% on any country purchasing Russian energy (i.e. China, India, Hungary, Turkey, Slovakia…);
- The USA is making noises about banning the export of diesel and other refined products
My take: One of the biggest risks in markets today is an energy crisis. The odds favour human ingenuity to solve the problems (more pipelines, more refining capacity, other energy sources, etc.). Still, those measures will take time to implement, and it’s not clear that there is much time.
3. The Robots Are Coming
To blunt the effects of slowing population growth, the choices are:
a) encourage people to have more babies,
b) attract more migrants, or
c) build lots of robots.
a) is not happening, b) is increasingly seen as a negative, which leaves c) as the only possibility.
Japan leads the world in robot manufacturing, accounting for 70% of global output. China recently overtook Germany to become the second-largest producer, while the USA is a distant third. This is probably not surprising, as both Japan and China face steep population declines.
Hot on the heels of the annual World Robot Conference, the 2nd World Humanoid Robot Games took place in Beijing in August, cementing the city’s status as a global robotics hub.
In the early stages of any technological revolution, both capital and policy support are prerequisites for breakthroughs. SpaceX didn’t get where it is today without massive support from the US government, both in capital and policy. In China, early-stage companies not only receive government (policy) support but also benefit from dense manufacturing capabilities developed over the past 20 years, which reinforce the development process.
Like everything else in the new world of electronics, robotics is a full-stack optimisation problem. Improvements across the stack reinforce gains elsewhere. Better training data and control policies enable more complex behaviours, which in turn drive the development of better actuators and sensors. Large-scale deployment then generates new real-world data, which can be fed back into the models. The speed of progress therefore depends not on any single breakthrough but on how quickly these layers can iterate together.
Most robots currently shipped are being built to make better robots. It’s comparable to autonomous driving: Tesla’s FSD only became viable after millions of vehicles generated enough real-world driving data to train its models. Today, robotics has only “tens of thousands” of data-collecting devices in the field – nowhere near critical mass. Yet.
But these robots matter as an antidote to population decline. GDP growth is always the product of population growth and productivity growth. If populations decline, what better way to boost GDP growth than by implementing a significant step change in productivity?
In the USA, Amazon uses robots extensively. Here is what’s happened to productivity per employee:
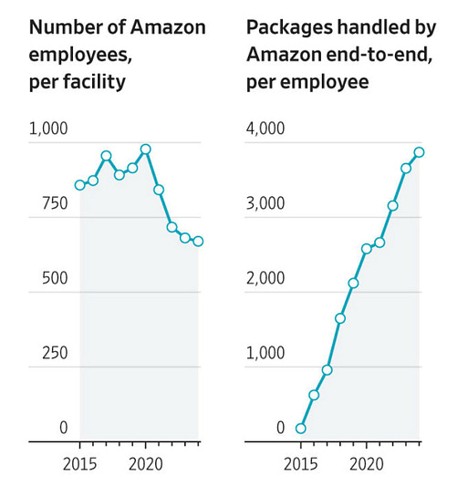
But robots aren’t replacing workers, as the Luddites would have you believe. Today, Amazon employs 1.1 million workers in the USA, 10% more than 5 years ago.
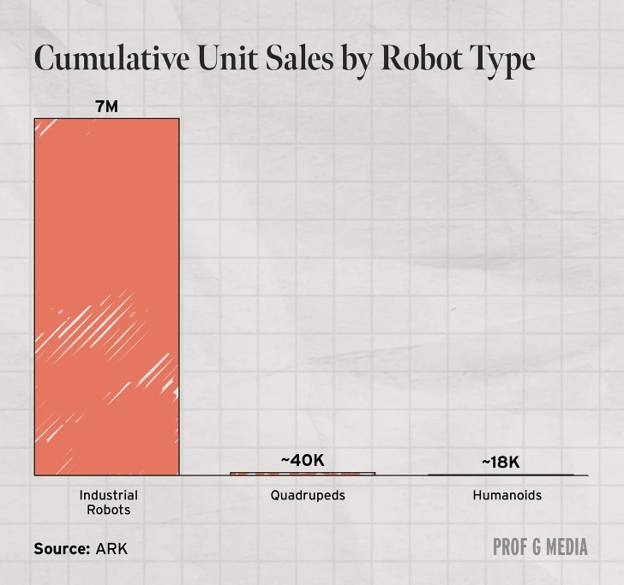
Now, when we read about robots, we immediately think of “humanoid” robots – robots that look like people and do things humans can do, just better. The problem is that they can’t. At least not yet. According to Prof. G, “one of the top humanoid companies in the world confessed that its robots are, at best, half as productive as the humans they’re meant to replace. But even that is misleading, as the robots can only perform unskilled tasks like stacking boxes and doing quality control.”
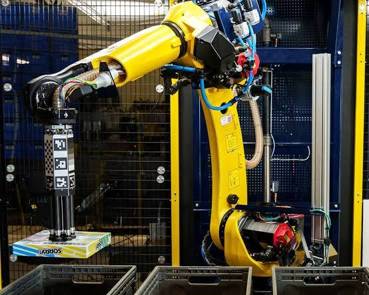
Yes, robots are a growth industry, but humanoid robots are not. Amazon groups its logistics robots into two main categories: mobile drive units that slide under pallets to move them across the warehouse floor, and intelligent robotic arms designed to scan, pick, and sort individual items. The robots look like this (to be clear, the robot is the one on the left):

And this:
Not this (Elon Musk’s Optimus robot):

UBTech, a Chinese robotics company (which I happened to visit earlier this year), reports that its humanoids are 30% to 50% less efficient than human workers. Again, from Prof. G:
But here’s Silicon Valley, trying to sell you a different story: Elon Musk has promised that 80% of Tesla’s value will come from Optimus (i.e. humanoid) robots, while Cathie Wood’s firm manages a robotics ETF.
And here are the facts: Cathie Wood is a grifter who sells dreams to the gullible. Her fund’s investment performance is shocking. The only person making money from her pipe dreams is herself. Despite his company’s technological advances, most of Elon Musk’s promises have either not come true or have been delivered much, much later.
Of course, the sell-side is acting as a cheerleader, as it always does. Morgan Stanley predicts that 1 billion humanoid robots will be in use by 2050. This implies adoption will grow at an unprecedented compound annual growth rate of over 50% p.a. for 25 years. At its peak, smartphone adoption grew by 30% to 40% per year for nine years before growth rates began to decline.
My take: Silicon Valley has some stock to sell you. Don’t buy it. On the other hand, don’t worry too much about the impact of a declining population. Human ingenuity has historically overcome adversity. I’m not a fortune-teller, but I believe the future won’t be much different.
In The Cockroach
As usual, there have been no trades in the local fund (the MWI Worldwide Flexible Fund). There was recently a (relatively) large inflow into the offshore fund, so that is busy getting back into line. Once things have stabilised there, I will report back.
In the introduction to this week’s letter, I mentioned GaveKal’s 4-quadrant approach, which looks like this:
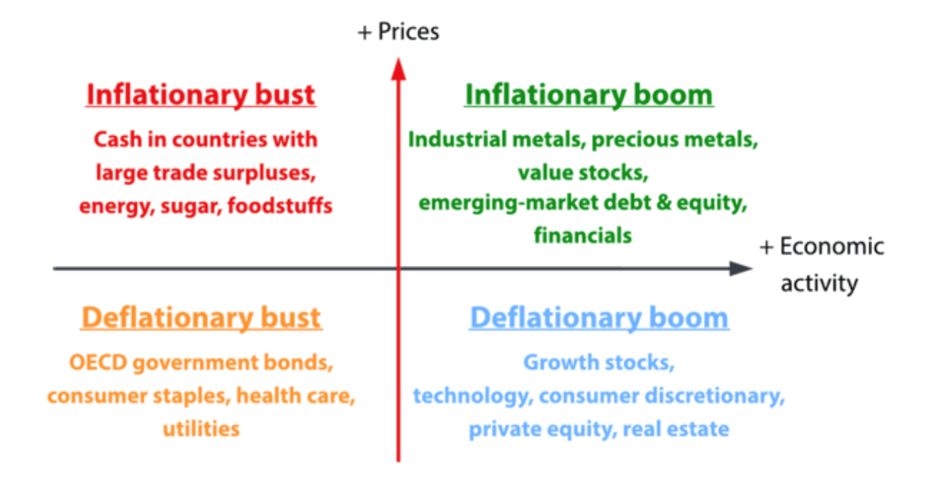
If we are indeed in a global inflationary boom, do I need to change the fund?
The answer is simple: cockroaches don’t know what type of environment we are in and have no idea what any future environment will look like. They survive by preparing for any eventuality, not a specific forecast.
To show this, let’s run through the fund’s exposure to each asset class:
a. Cash
The fund holds the 25% it allocates to money market assets predominantly in countries with trade surpluses: Japan and South Africa. Both have undervalued currencies. So we have the “inflationary bust” quadrant covered. The fund also has some exposure to US$ because it always “thinks” in terms of US$ returns. If a deflationary bust occurs, these US$ will come in handy.
b. Bonds
25% of its value is allocated to bonds, specifically Emerging Market Bonds, so the inflationary Boom quadrant is covered. Within that allocation, the largest exposure is to South African (and Namibian) government bonds. The SA bond market remains one of the best-performing in the world, offering attractive returns in excess of inflation.
c. Equities
The fund’s equity exposure is mainly concentrated in the bottom half (deflationary environment) of the chart: consumer staples (Nestle) and consumer discretionary (Nintendo, Hermes, Walt Disney). It also has strong exposure to growth and technology via the MSCI World and MSCI Emerging Market indices (which are heavily weighted towards those sectors). It also has some exposure to value stocks via the outperforming MWI Value fund.
d. Hard Assets
The fund’s hard-asset allocation covers the top half of the graph (inflationary environment). Here, the exposure is mainly to precious metals (gold and platinum), with some energy exposure via the Energy SPDR ETF, $XLE. The portfolio also has land exposure via Texas Pacific Ltd and St. Joe, as well as Bitcoin exposure via $FRMO and $CMSG.
In conclusion, the cockroach is prepared for any eventuality, and will survive – and yes, even thrive sometimes – without having to make or act on any forecasts.
* I manage the fund on behalf of Merchant West Investments (Pty) Ltd (FSP 44508)
In The Media
1. The best music of 2005
One of the year’s highlights for me was Kate Bush’s double album Aeriel, in which one song’s chorus consists of the first 30 digits of Pi. The other choruses carry on where that one leaves off, counting the decimals down 30 by 30. Pi is an irrational and transcendental number, which, of course, explains the song. The album also has many other great tracks for those less numerically inclined.
The live album by Jason Molina (Magnolis Electric Co.) was also, in my opinion, one of his best. Ryan Adams produced a masterpiece with his album 29, while Shelby Lynne’s soulful country music was a revelation. Not to forget Fiona Apple’s extraordinary album, Extraordinary Machine.
My most vivid memory from 2005 was the devastation Hurricane Katrina caused in New Orleans. Having lived there for three years as a young boy, I was shocked by the images. What was even worse was the US government’s response, which showed that South Africa doesn’t have a lock on a weak and incapable government.
Here are the ten best albums, on Apple Music and Spotify.
And, as usual, my pick of the top 20 songs, ranked from 20 to 1, on Apple Music and Spotify.
Also, the long list of good songs, only on Apple Music.
I hope you find something that brings you joy in these playlists!
2. Long-term investing
Compounding is truly the 8th wonder of the world. The longer the period over which you can compound, the more powerful it becomes. So the most important thing is to stay in for the long haul. Warren Buffett is still going strong at age 95, which has enabled him to compound for an additional 20 years compared with the average person. During those 20 years, thanks to the power of compounding, he generated 70% of his wealth ($98bn of his current wealth of $144bn).
So here are 5 simple tests you can do to see how long you are likely to live. There are some fascinating – and scary – charts in here. But don’t worry if you score poorly – start doing what needs to be done. It’s never, ever too late to start.
3. Effective altruism vs. utilitarianism
Effective altruism is a practical decision framework. It asks: given limited resources, how can we do the most good? It emphasises evidence, cost-effectiveness, cause prioritisation, and impartiality. The tech community has increasingly adopted it as a philosophy.
By contrast, utilitarianism says that the morally right action is the one that produces the greatest overall well-being, happiness, or utility. Everyone’s welfare counts equally, at least in principle. It is the founding philosophy of the United States.
Taken to the extreme, both ways of thinking can have interesting unintended consequences. So this discussion by Noah Smith is a fascinating read on the current moral state of the world – or at least the USA – and in which direction things seem to be heading.
That’s it for this week. Except for this picture from our wedding 5 years ago. I think it captures the spirit of the day perfectly. Vellie (with obligatory Affies logo) vs Gucci:

Remember to take care out there.
Piet Viljoen
RECM
1 October 2026